
A short, horror story . . .
A village awoke to discover sewage flowing from a storm drain into its drinking water source. The horrified people gathered at the village center and, after a lengthy debate, decided to weld the storm drain shut.
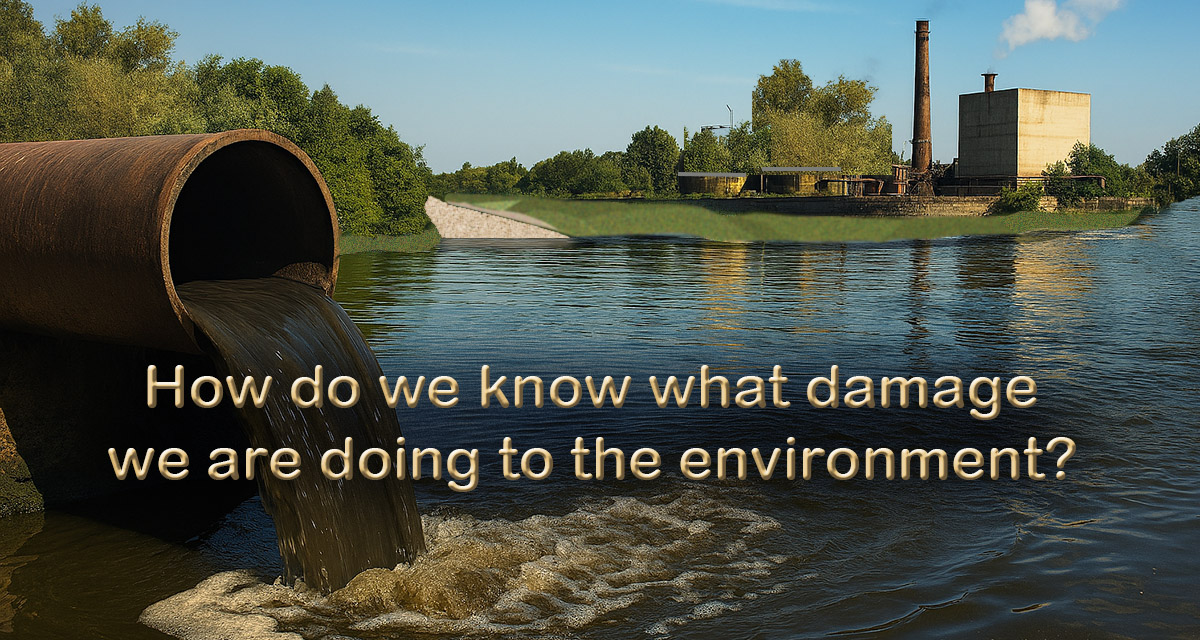
Surely, nobody believes that a village would think this storm drain is the problem, or that welding it shut would fix things, but I see people making that same mistake again and again. The mistake I refer to is creating a solution to a critical problem without fully understanding the problem and without understanding the full impact of the solution they choose. In this story, we can all imagine the disastrous consequences of their solution. In this case, the pipe is not the problem, and plugging it is not the solution.
The sewage pouring from the storm drain above results from a breakdown in one or more elements inside a lifecycle. This lifecycle (depicted below) begins with using air and water to grow food, continues through consumption of the food and the creation of human waste, and ends with cleaning that waste of toxins and organic contaminants before returning the water and air safely to the environment and sequestering the sludge in a landfill. With proper precautions, this lifecycle is seems sustainable. That is to say, we might repeat this lifecycle time and again, without impacting the long-term future of our children or their children. A simple lifecycle diagram (LCD) maps out the paths found in this cycle.
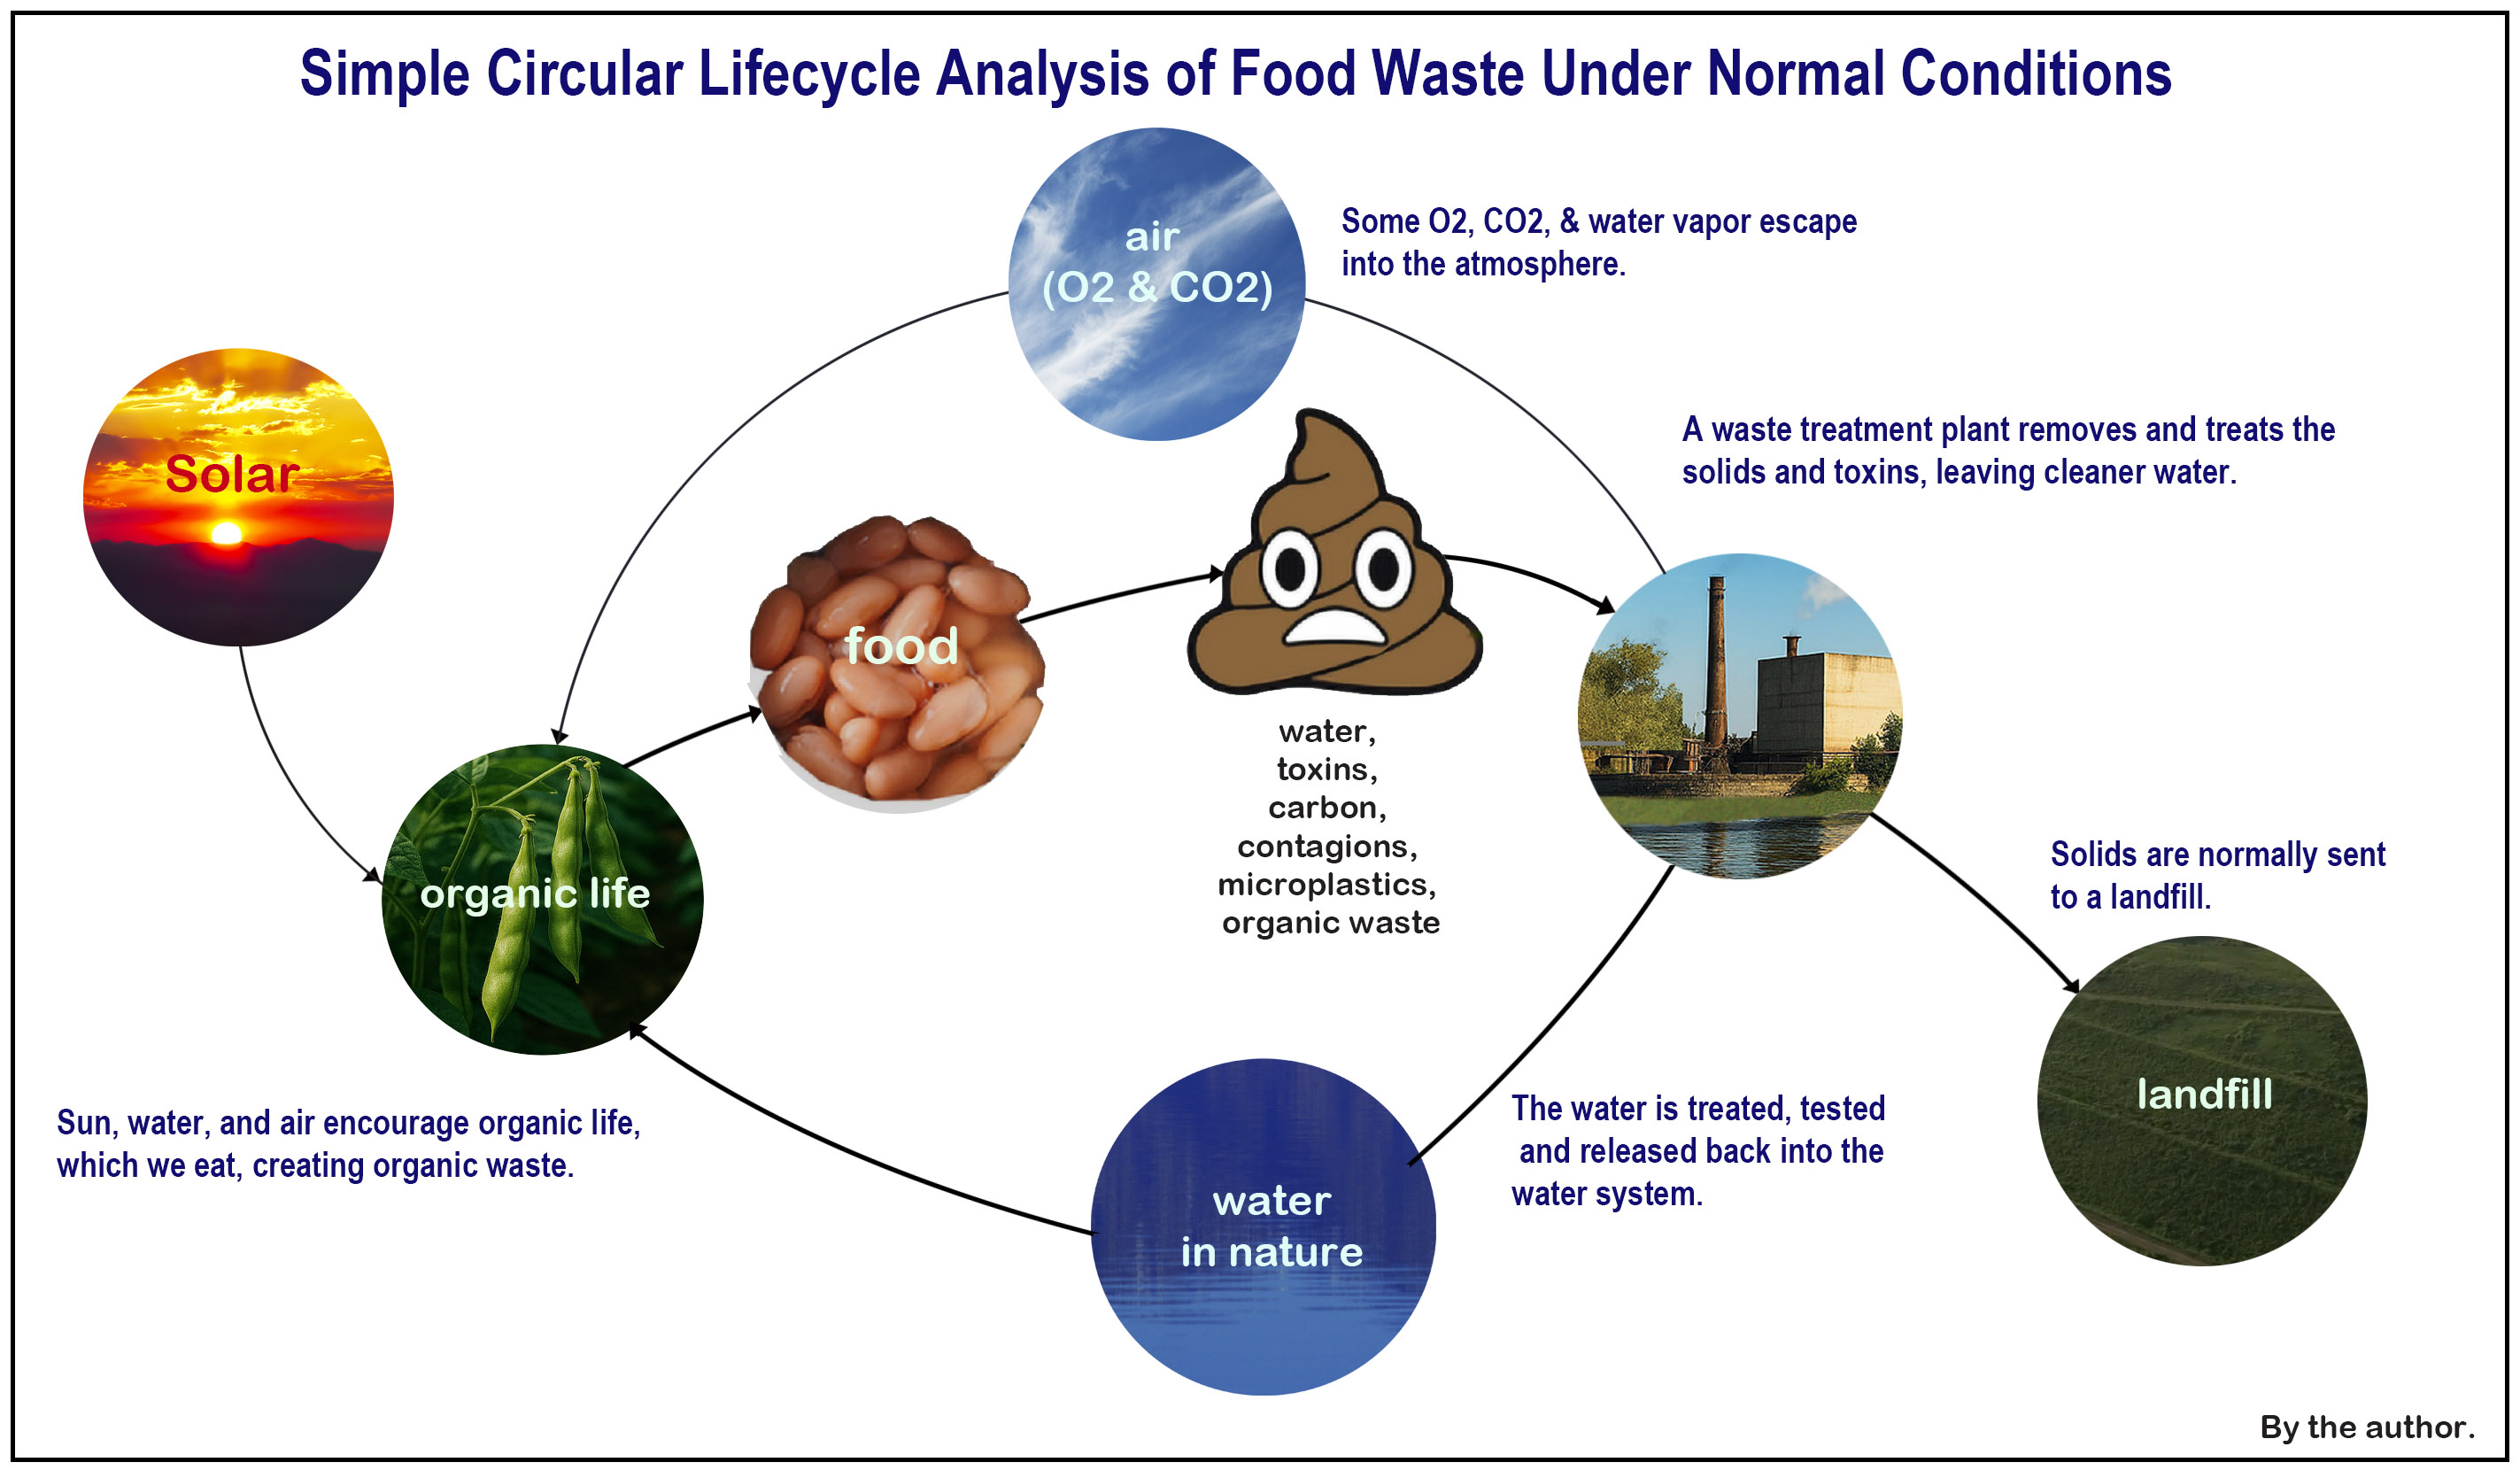 Figure 1: This chart is a simple representation of the lifecycle of organic waste that finds itself in the sewer. In most cases, the relatively solid waste (known as sludge) is sequestered in a landfill. This sludge will be trapped in the landfill for as long as the landfill remains intact. The cleaned and tested water is returned to the water cycle. The cleaned water is not potable, but it is comparable to most water found in nature, and so can later be safely treated for drinking.
Often, components of the cycle are repeated (water and air), while others are sequestered (carbon in sewer sludge). In a perfect world, all of the CO2 pulled from the atmosphere would be sequestered for centuries to come – an excellent example of carbon capture and sequestering. But we all know that we do not live in a perfect world. The truth is that there are approximately 100,000 operating and retired landfills in the United States, and virtually all of them have plumes of toxic water under them and methane gas above them. Landfills are the 21st-century equivalent of welding the pipe shut.
There are approximately 100,000 operating and retired landfills in the United States, and virtually all of them have plume of toxic water under them and methane gas above them.
But the news isn’t all bad.
With reasonable compromises, we can have paths to cycles where we do no damage to our children’s futures, even if those paths are less than perfect. So, if we are unable to sequester all (or even any) of the CO2 we pull from the atmosphere, we are not improving the atmosphere, but we are not damaging it (a carbon-neutral result), so the cycle is still sustainable.
Unfortunately, it is possible for us to do much worse than not damage the atmosphere, and so “much worse” is the path we usually seem to follow. In the United States, this food-to-waste lifecycle is usually poorly managed, so we end up with a cycle that leaks methane into our atmosphere and sewage into our water, and most of us have no idea how much. The truth is, despite the fact that we live in a “developed” country, many of us live with the same scenario as the village at the top of the page.
The villagers’ mistake was to think the sewage was the problem,
so they sealed its exit.
A lifecycle can be used to locate the impacts its elements are having on other elements, as well as the impacts other elements are having on them. The lifecycle impact analysis (LCIA) below helps us identify where to look for the problem.
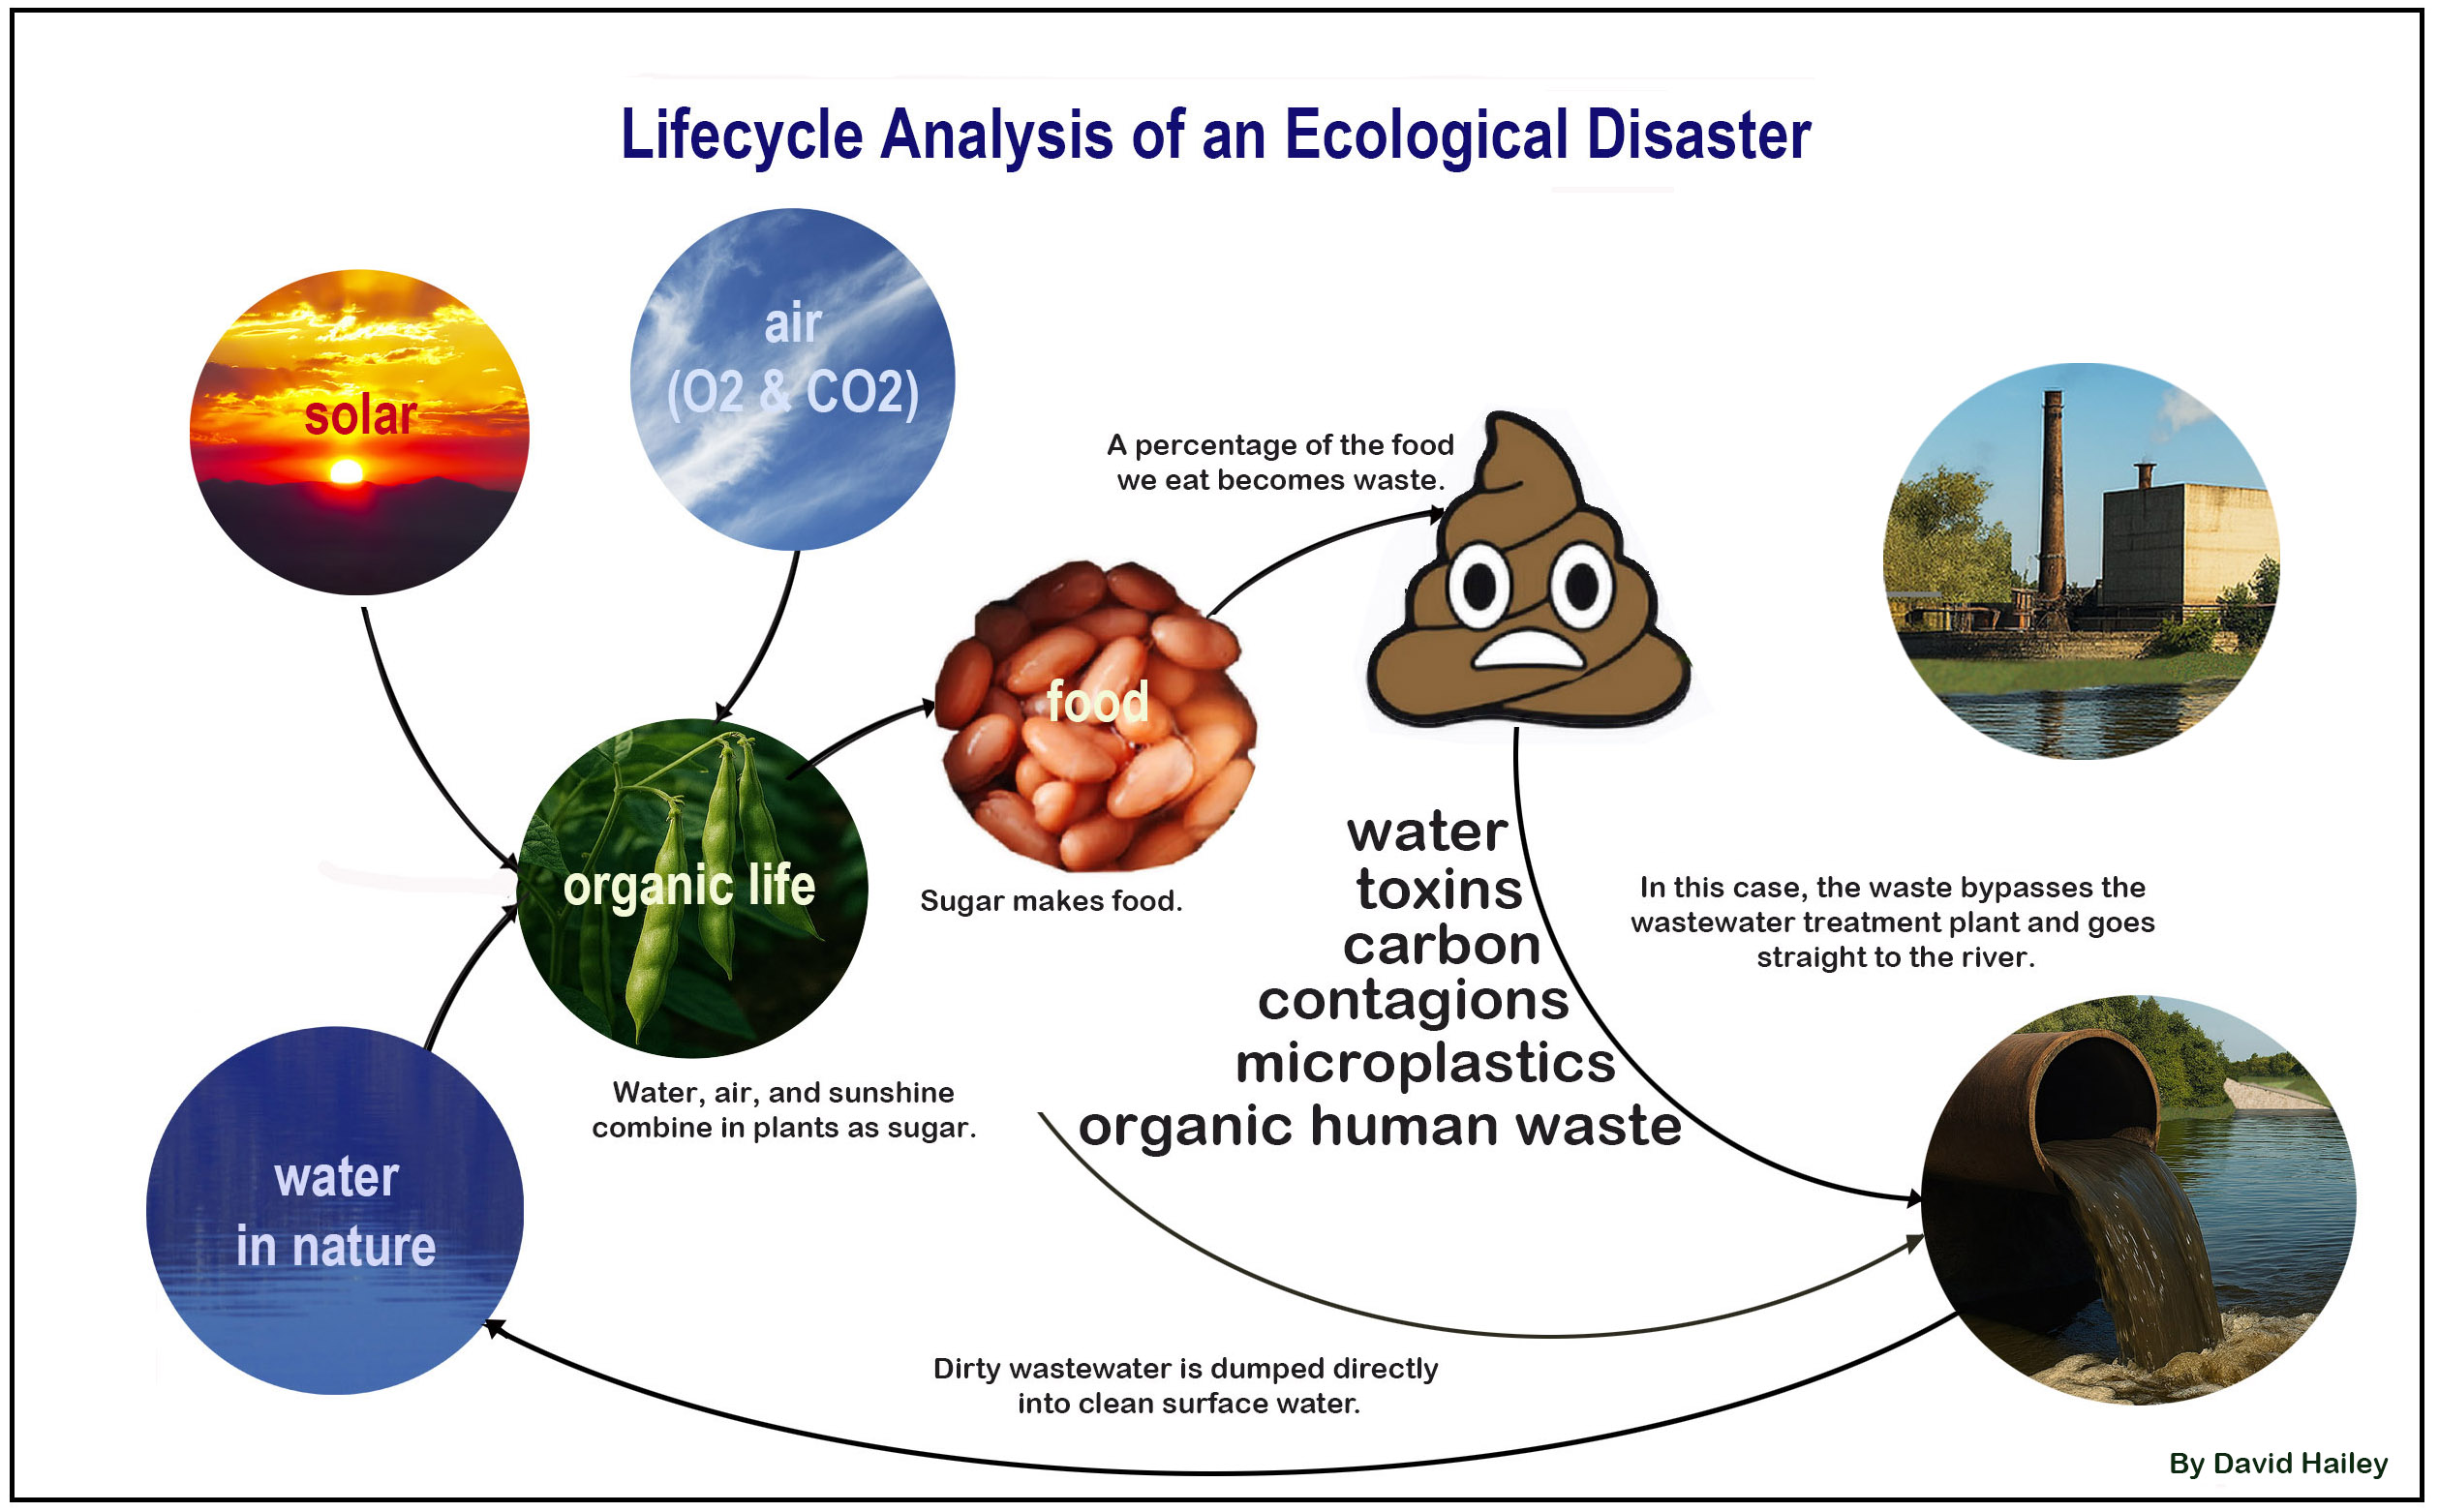 Figure 2: The obvious problem with the lifecycle of these beans is that an important step is being missed. This might be due to a leak, flooding, a plugged valve, or someone absentmindedly opening a wrong valve. This simple Lifecycle Impact Analysis (LCIA) helps us view the process within a larger system and recognize that the lifecycle extends beyond the sewage pouring from the pipe.
This LCIA is very simple, and the problem is glaringly obvious. The negative impact occurs when the sewage bypasses the treatment plant.
Repairing the break in the cycle above might be as easy as finding and closing an open valve, but in a worst-case scenario, a tank (called a “lagoon”) is leaking into the groundwater, and groundwater full of sewage has pushed itself through a break in the storm drain system. Repairing that will be demanding and expensive, and in the past, repairs like this have sometimes proven impossible.
The breach bypasses the cleansing phase of the water’s lifecycle, turning a closed-loop system into a broken loop. The liquified sludge leaking into the ground and then into the groundwater might well go unnoticed for decades until people begin dying of cholera (as happened in London in four different events). In this case, it was discovered when it poured out of the storm drain.
Whatever causes it, such a leak can usually be repaired. Once repaired, the complete cycle in Figure 1 becomes the appropriate model. The new LCIA maps the normal situation, in which wastewater flows to a treatment plant that cleans and tests it before returning it to the environment. The sludge extracted from the water is usually dried and trucked to a landfill.
Lifecycles are really collections of lifecycles – fractals in a sense.
If we look at the beans, we don’t see the can, but there was one. That means that the beans are a part of the can’s lifecycle. A comprehensive evaluation of the beans’ lifecycle carbon impact would include the can and all the processes it undergoes, because the beans' carbon impact includes the carbon emitted during extraction, smelting, transportation, manufacturing, and disposal of the can.
That said, an LCA can be as complicated or as simple as we need to parse the information we are looking for, and if we are not careful, what we are looking for might actually be missing from the LCA. For example, if we look at Figure 1, we see that, once pulled from the water, the sludge is usually sent to a landfill. That seems benign enough, but if we take the time to examine the impact of the sludge on the landfill, we find it is another example of welding the storm drain shut. All of those tons of sewer sludge are lying in pits full of leachate (toxic water) directly above our groundwater.
What happens to the sludge in the landfill?
Even well-run landfills look like something from a horror movie — like chaos threw a party and forgot to clean up.
A second benchmark comes from a BEV charging from the grid. The carbon impact of that vehicle depends on the grid. In West Virginia, more than 90% of the fuel for that power is coal. In Texas, around 55% of that power comes from natural gas and coal. Vermont energy comes from biomass and is 95% clean.
A short, relevant story . . .
Still, you shouldn’t judge the landfill for that act. Animal slaughter is not permitted at landfills; it’s illegal and morally repugnant, but landfills are vast, noisy, and chaotic. With dozens of dozers moving mountains of waste, who would hear a gunshot? Someone committing that kind of violence could easily go unnoticed.
Something you might not know is that, for all the noise and chaos and horror stories, landfills are all very organized. I would never call the organization of the movement at a landfill a “ballet,” but it has that kind of choreography. Everything in the ensuing dance is meant to keep all of the horrors within the confines of the landfill.
But what happens when we add E85 to the mix?
You might know E85 as “flex fuel.” Essentially, E85 is a blend of 85% ethanol and 15% gasoline. As it shows in the graph above, substituting gasoline with E85 improves the footprint of all hybrids significantly.
When flex-fuel hybrids become an option, for someone who lives in an environment that precludes reasonable ownership of a BEV, a flex-fuel hybrid may be just as good. Some people might live in condos or townhouses, or similar environments where a car might be charged, even from a 120V circuit. For them, a plug-in hybrid is even better.
Excellent landfills look like piles of rubbish, but they are really fortified prisons.
The scores of people in a landfill are not just piling trash on top of trash out on empty ground (that would be a “dump”). The landfill will have been designed by an architect to handle cells full of waste material. Layers of an impenetrable membrane are laid on top of a thick layer of clay covering a carved depression. The membranes are chemically welded together to form a giant waterproof shield that is supposed to prevent leachate from leaching into the groundwater.
Once underground, most inorganic trash (excluding hazardous materials) is content to simply lie there for the next 200 years. Organics, however, are not so blissful. Sewer sludge, for example, immediately begins merging, along with all of the garbage, into any water, recreating a sewage much worse than what it was before going to the wastewater treatment plant.
Landfills have a long history of failing. NASA shows it to us for free!
NASA’s satellites and Carbon Mapper’s data portal track methane emissions from landfills, oil fields, and power plants. While landfill leaks are smaller than those from fossil infrastructure, they’re still significant.
Leachate is worse because it is underground, and passes undetected until we find it in our water.
Garbage is usually wet when it arrives at the landfill, and any rain or snow that falls there collects in the pit. Leachate collects in the bottom three feet of the landfill, oozing out through any breaks in the bottom-most membrane. If we remember the machines used to move the garbage around, it is easy to imagine how there could be breaks.
There are a number of studies that indicate that leachate-contaminated groundwater is common. In one study by the U.S. Geological Survey, 22 landfills across 12 states were studied: the study discovered that contaminants were leaching out of every site studied.
So, although we might have repaired the leaking valve at the waste treatment plant, the disaster that occurred there continues to unfold across all of our landfills nationwide. If the villagers plugged their storm drains, they would soon discover their error. But if they repaired the damage at the source, they would still be missing the ultimate problem – the landfills. They just moved the problem from the wastewater treatment plant (where it is visible) to the landfill (where it is out of sight), but it is the same problem – sewage leaking into our groundwater and methane wafting into our atmosphere.
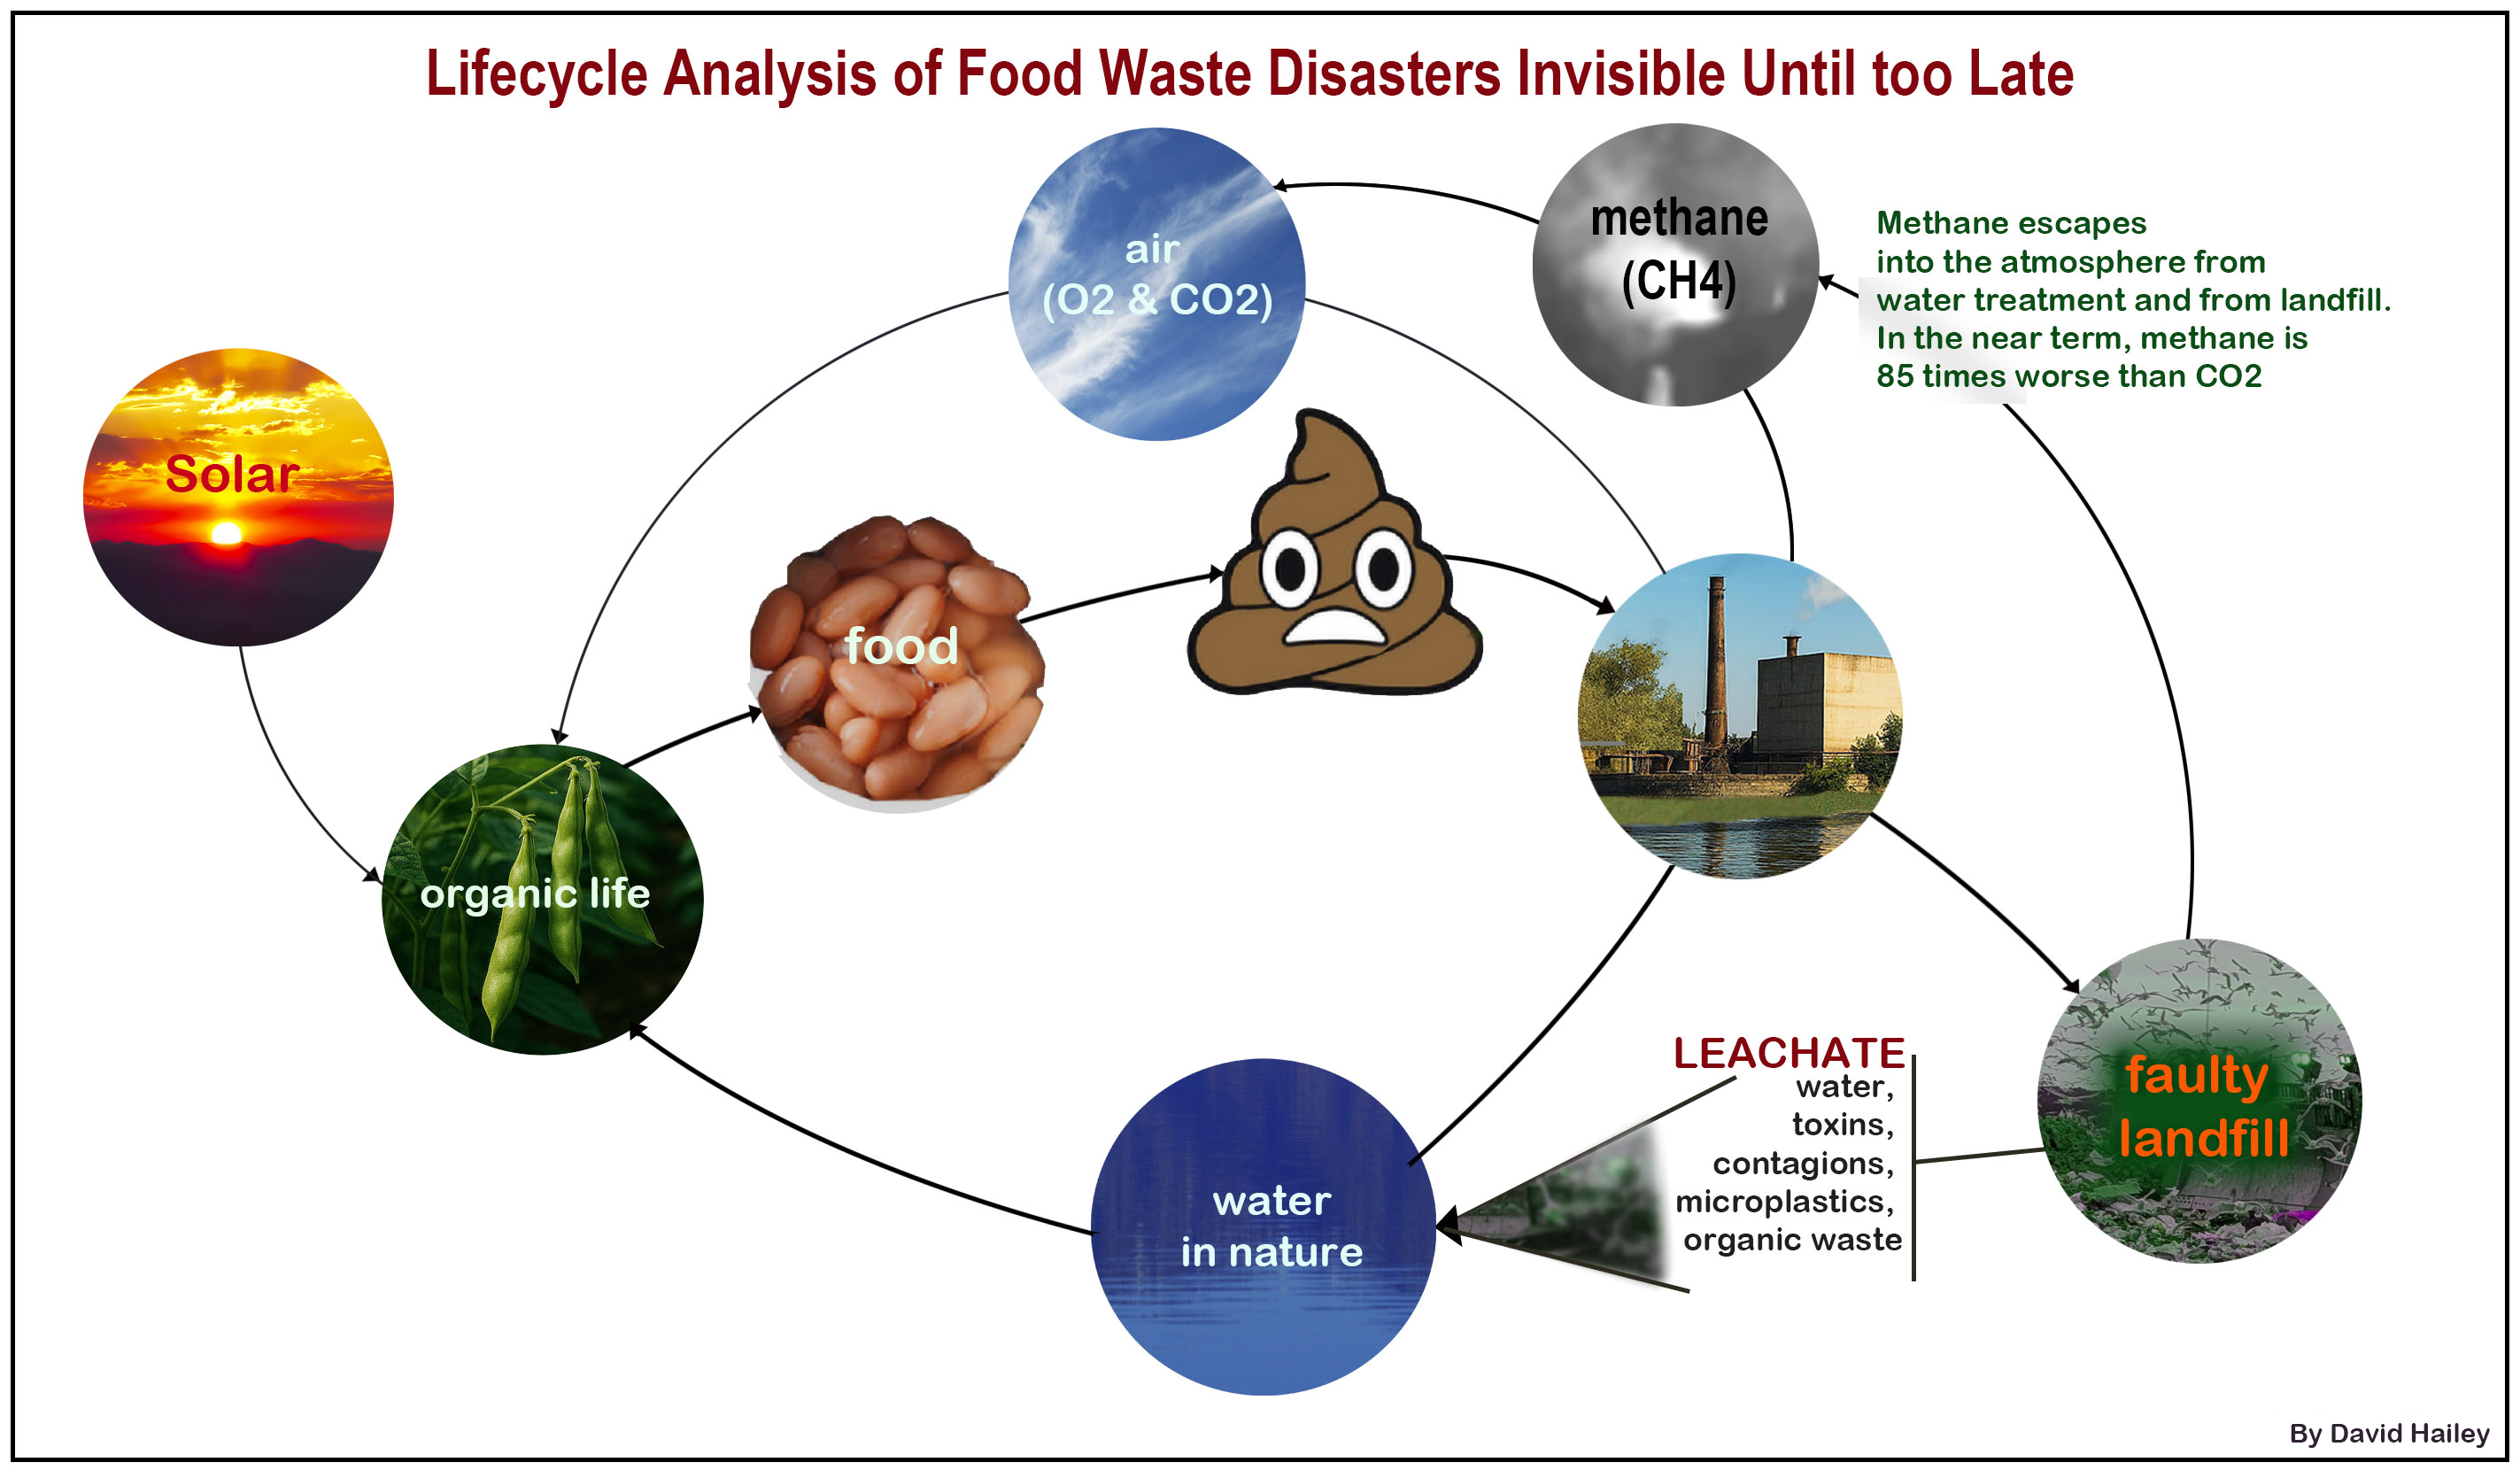 Figure 3: If we simulate closing the valve, the treatment plant begins working, but where do all of the toxins go? Well, now the plant begins pumping methane and CO2 into the atmosphere. Moreover, now that the sludge is no longer flowing out of the pipe, it is being sent to the landfill. Many are careful about using landfill liners to keep liquids and gases contained, but many are careless about it. We can no longer see the toxins pouring into the reservoirs, but the toxins have not gone away. They are now festering in the landfill, creating a witches' brew called “leachate.” In the meantime, the organics are breaking down into methane, which is leaching into the atmosphere. The toxins haven’t disappeared; they are simply leaking out into our environment.
In short, the combined methane output today from wastewater treatment plants and landfills equates to ~220 million metric tons of CO2 per year, and even today, every landfill measured by the USGS is still leaking leachate.
There is a path to sustainable human waste.
I have presented an unsustainable problem, but there are solutions, and these solutions become paths out of this quagmire. The wastewater arriving at a treatment plant contains huge quantities of unused energy that we just throw away. The reason the landfill emits so much methane is that methane from organic waste is a natural byproduct in an anaerobic (oxygen-free) environment.
Since landfills naturally generate methane, some landfills are equipped with plumbing that provides the methane a route out of the trash. That methane is collected, processed and used. The city of San Antonio, for example, powers its municipal buses with landfill methane. Unfortunately, of around 2,500 wastewater treatment plants, only around 350 produce fuel from wastewater. If every organic waste source in the U.S. were tapped, we could produce approximately 50 million tons of renewable natural gas (RNG) annually. The methane sources could include food waste, yard trimmings, agricultural waste, manure, forest litter, and wastewater biosolids. Other organic sources readily yield ethanol, methanol, synthetic gasoline, and synthetic diesel (to name a few). We are throwing all this away. In some cases, landfills pull the methane from within the cells and burn it with the sole goal of keeping it from escaping as methane.
A path to using sewer sludge to create fuel with a zero-carbon impact.
Leachate can be captured and recycled through the wastewater plant, where it can be cleaned up and returned to the environment. In the meantime, the leaking methane can be captured as it is produced by the landfill and can then be converted into fuel. This can be done using technologies that have existed for more than a century. That said, if our wastewater treatment facilities and landfills are leaking methane by the ton, why not capture that methane and use it for fuel?
We can convert the sewer sludge into methane at the treatment plant.
At the waste treatment plant, the sludge is moved into huge, oxygen-free, covered “lagoons.” Then oxygen-hating bacteria convert the sludge into methane. The end product is around 60% methane that can be burned for fuel and 40% biosolids that can be upgraded to fertilizer, sent to a landfill, or incinerated.
The City of Austin processes 1.5 million gallons of sludge per day and generates 850kWh of electricity from gas, saving approximately $550,000 annually. Digested sludge is upgraded to Dillo Dirt (a particularly fertile soil), used across the city in parks and other public spaces, or sold to the public.
As you can see from the photos below, these “anaerobic digesters” can provide gas for a whole city the size of New York, or for a remote town or village in Africa, where villagers who once cooked with wood and dung are now cooking with gas. As an aside, these Africans are also reading at night with light from a solar microgrid (but that’s a story for a different article).
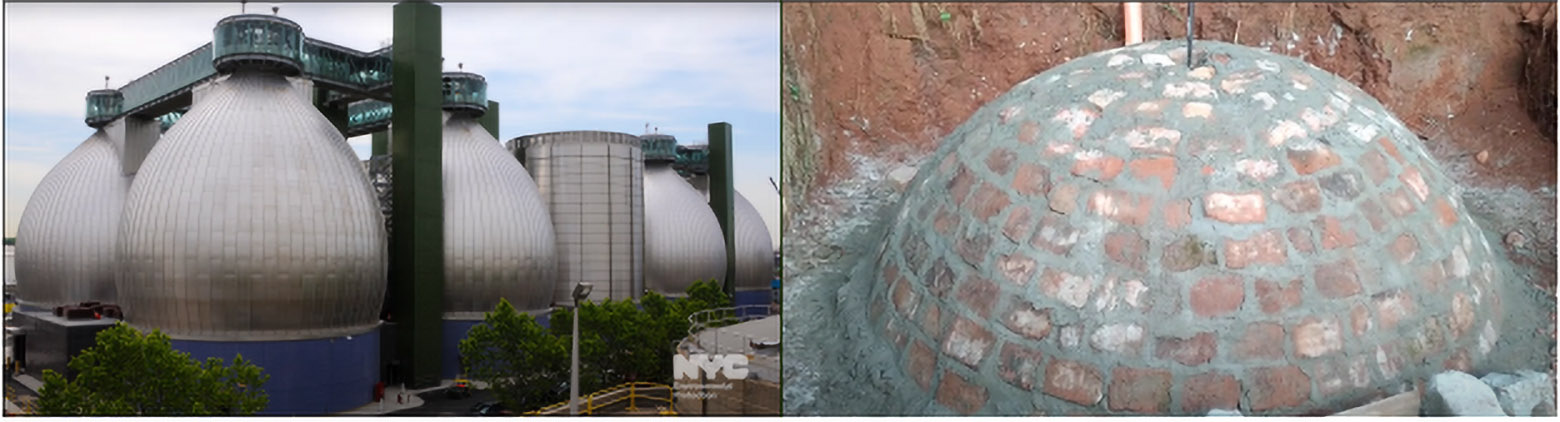 Figure 4: On the left is a New York City (Newtown Creek) digester, producing more than a billion cubic feet of biogas per year as part of the Newtown Creek Renewable Gas Demonstration Project. On the right, a digester provides methane for a small community in Kenya. This tank is approximately 9 feet across and 12 feet deep. (Image used with permission.)
Dairies commonly use this process to provide methane for powering equipment and to provide household gas. They use human and animal waste for feedstock, and often have enough methane that they can run generators and sell keftiver biofuel to local natural gas providers.
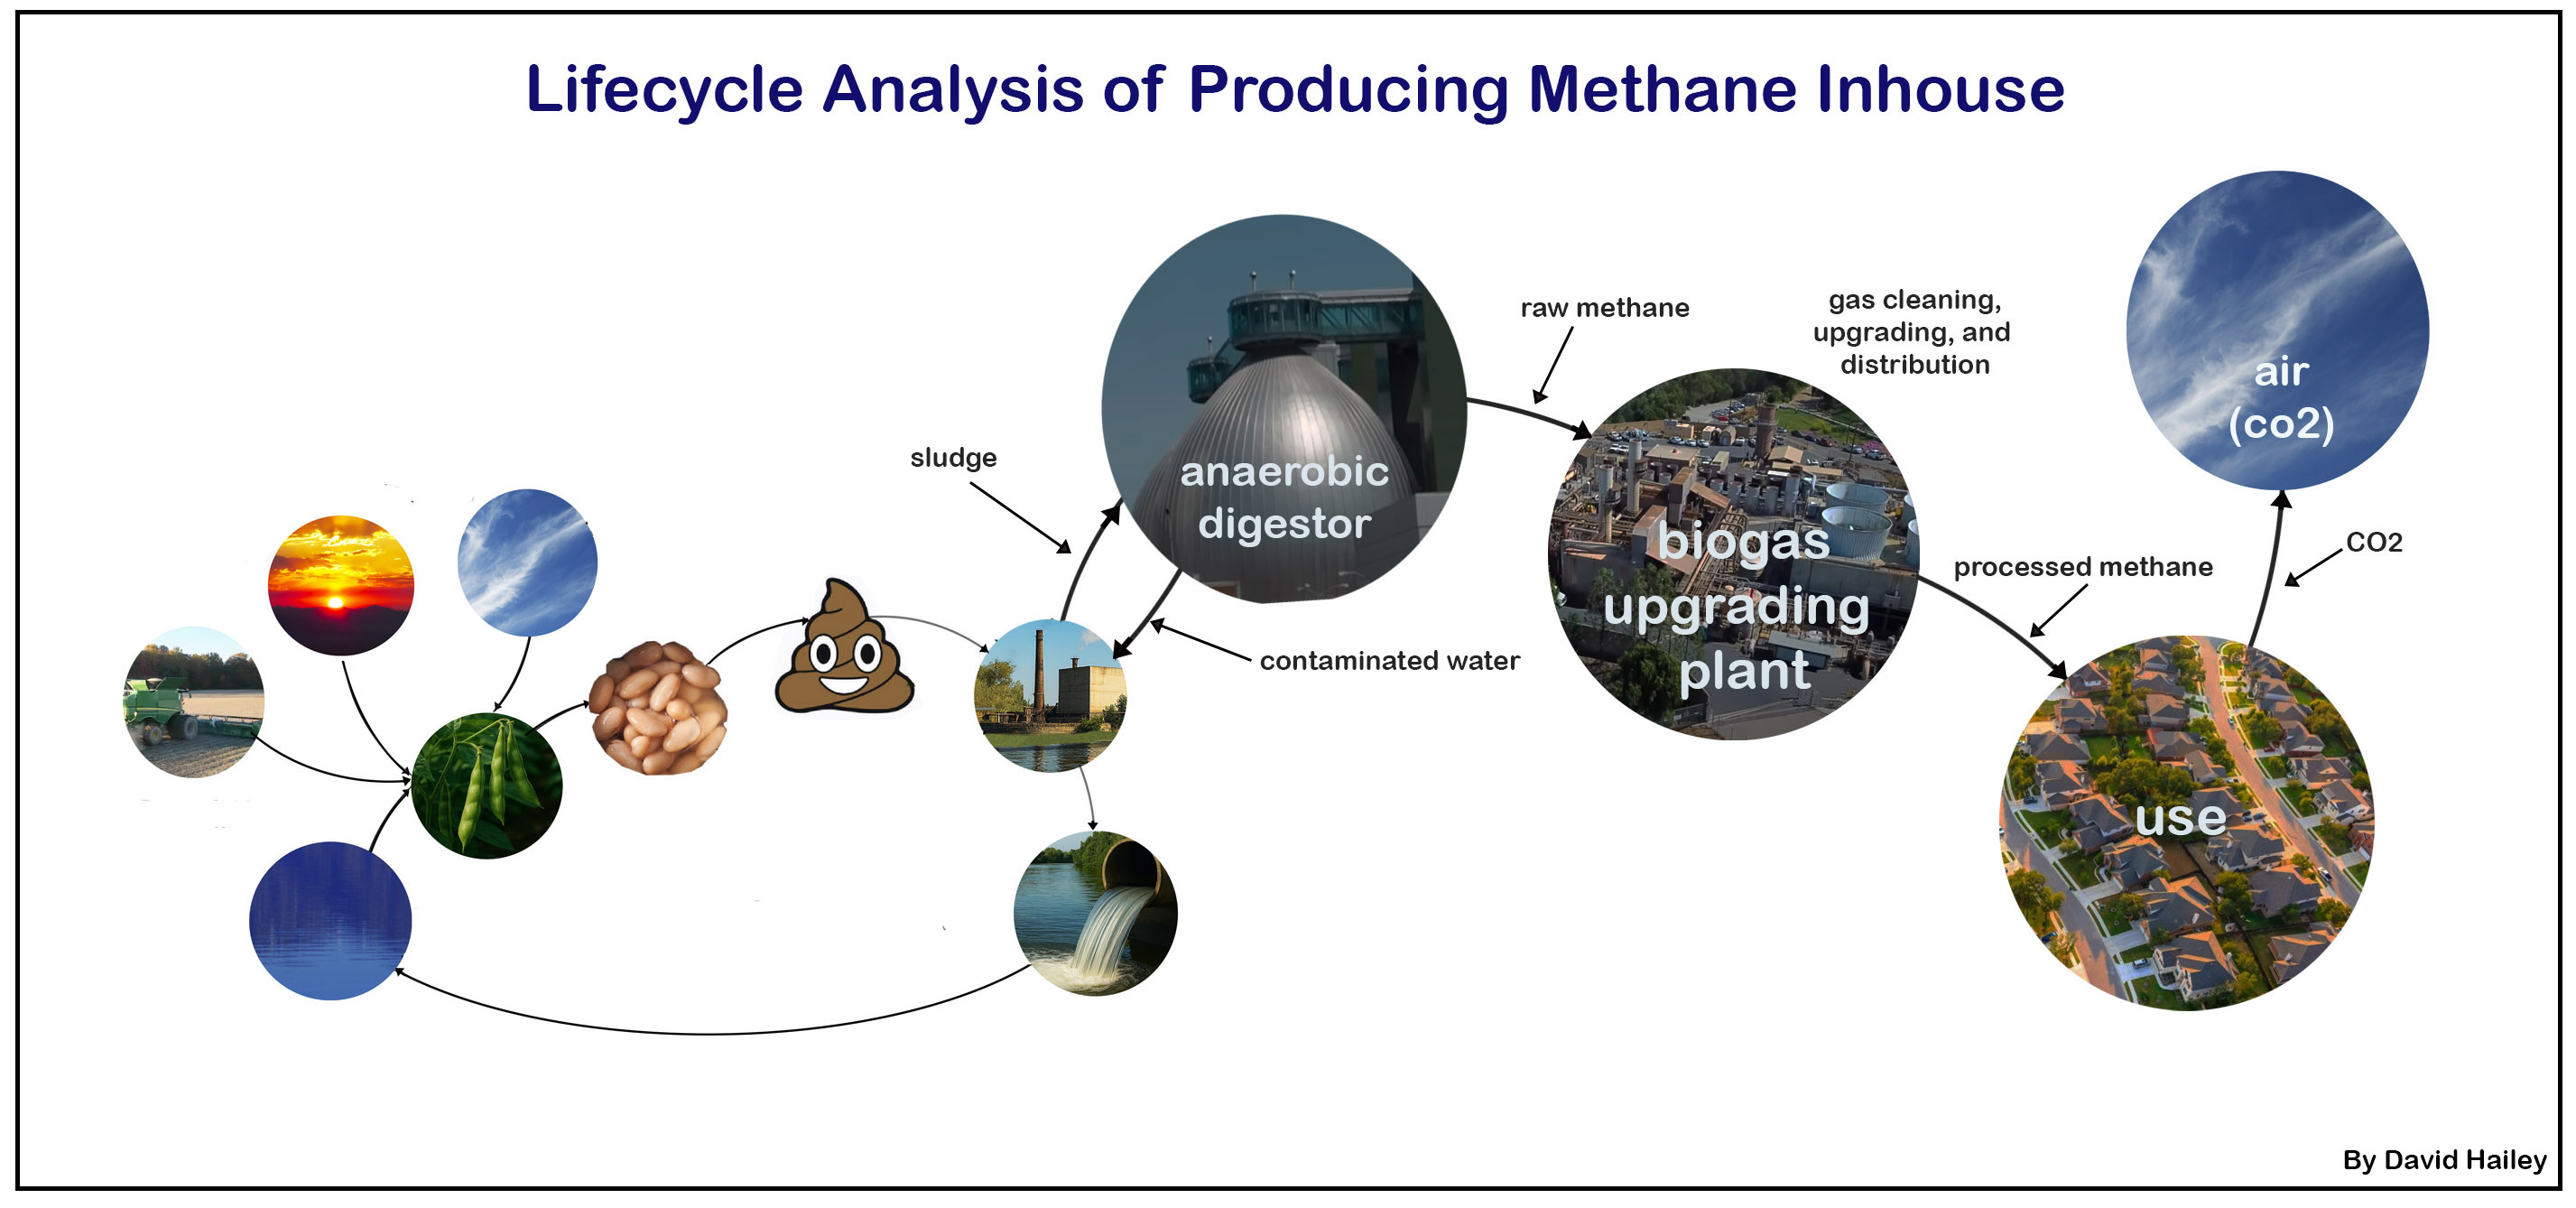 Figure 5: Anaerobic bacteria in an anaerobic digestor consume sugars, amino acids, fatty acids, and other carbon-based compounds in sewer sludge, food waste, manure, or decaying plant material (as in bogs). They produce methane, organic acids, hydrogen gas, and CO2 as byproducts. In a biogas upgrading plant, impurities are removed, leaving nearly pure methane for use as a fuel. (For more information on this process, I recommend Https://chptap.ornl.gov/profile/99/HornsbyBiosolids-Project_Profile.pdf
Producing and capturing methane in a landfill.
In the chart below, we see the landfill being the vehicle for capturing methane from human and food waste. The landfill pit is lined with clay and an impermeable membrane (as described above) and is divided into cells. The tightly packed cells are virtually devoid of air, and so oxygen-hating bacteria generate methane, which migrates to the nearest escape route, and that happens to be a collector pipe that pumps the methane to a gas cleaning and upgrading plant. The plant then distributes the methane to its ultimate destination.
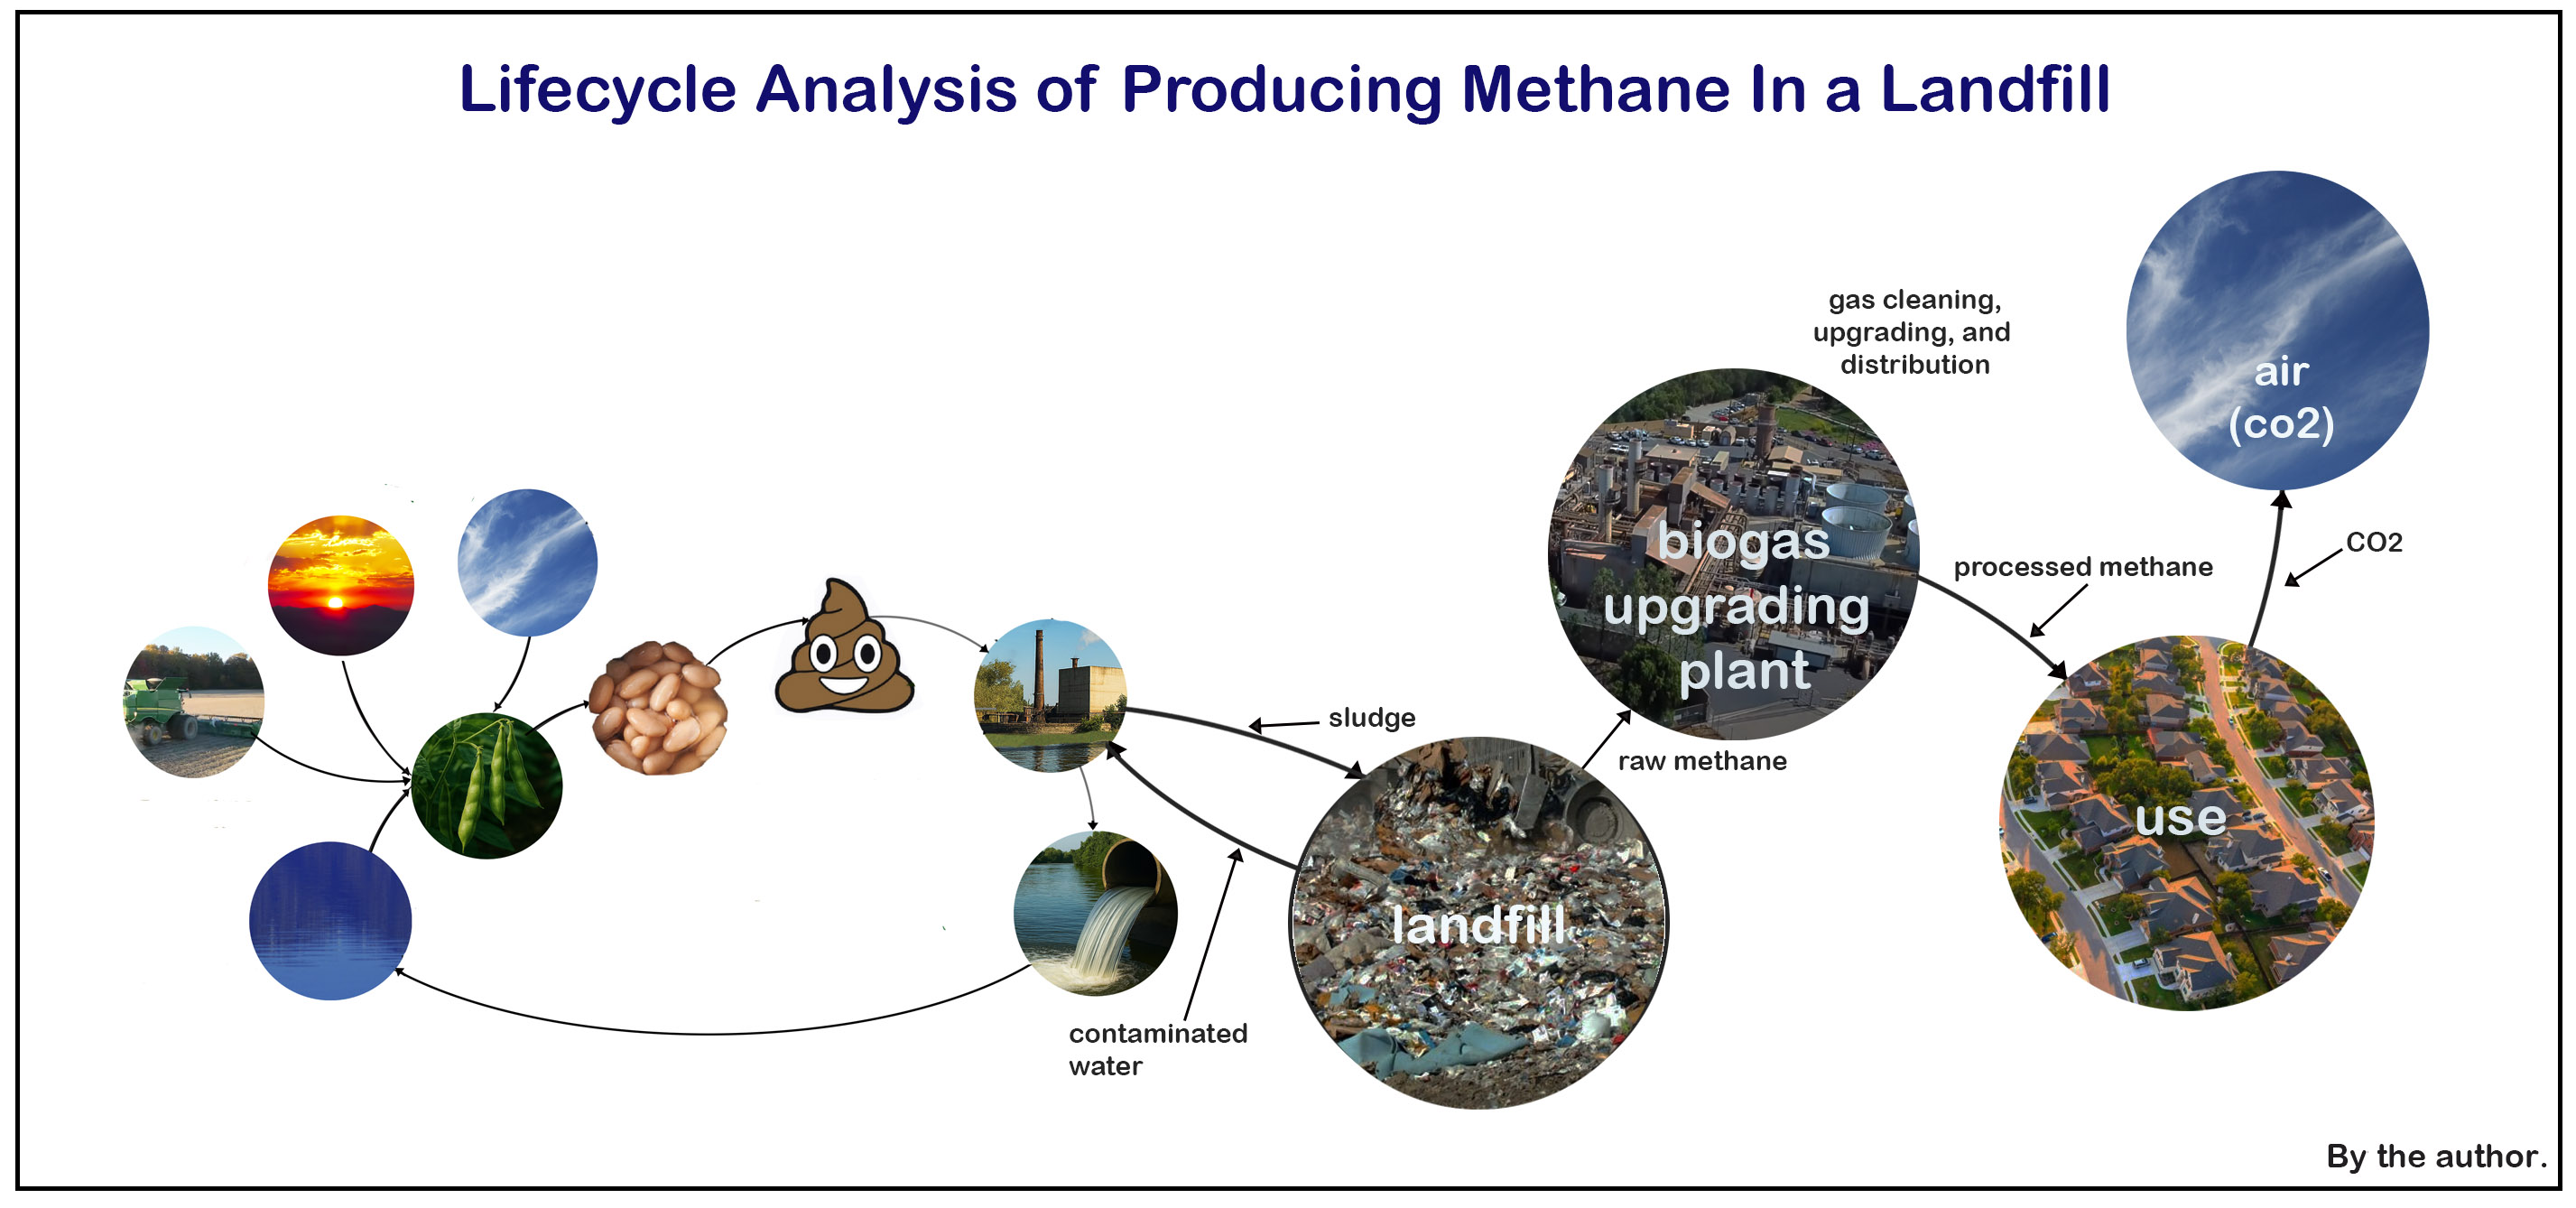 Figure 6: In the cycle here, CO2 and water are captured by plants, which become food. Naturally, once eaten, the food becomes human waste, and the waste is carried to the wastewater treatment plant. Once treated, the water returns to the ecology, and the sewer sludge is sent to the landfill, where it is digested by anaerobic bacteria. Methane generated by the bacteria is pumped from the landfill, is modified in the biogas upgrading plant, and is sent to the market. Finally, the methane is used, releasing CO2 back into the atmosphere. Since the CO2 originally came from the atmosphere, its impact is more or less neutral.
These represent two paths for capturing methane from landfills and wastewater treatment plants and using it for clean energy.
When we use the methane we make in landfills and wastewater treatment plants, we are left with a tiny carbon impact. The CO2 in the organics we eat or use and discard comes out of the atmosphere, so if it goes back into the atmosphere, there is little harm. Energy is used in the processing and shipping of these materials, and that energy adds to the final carbon impact.